What Aggregated Data Reveals About Engagement Cycles in Legal Mobile Prize Platforms
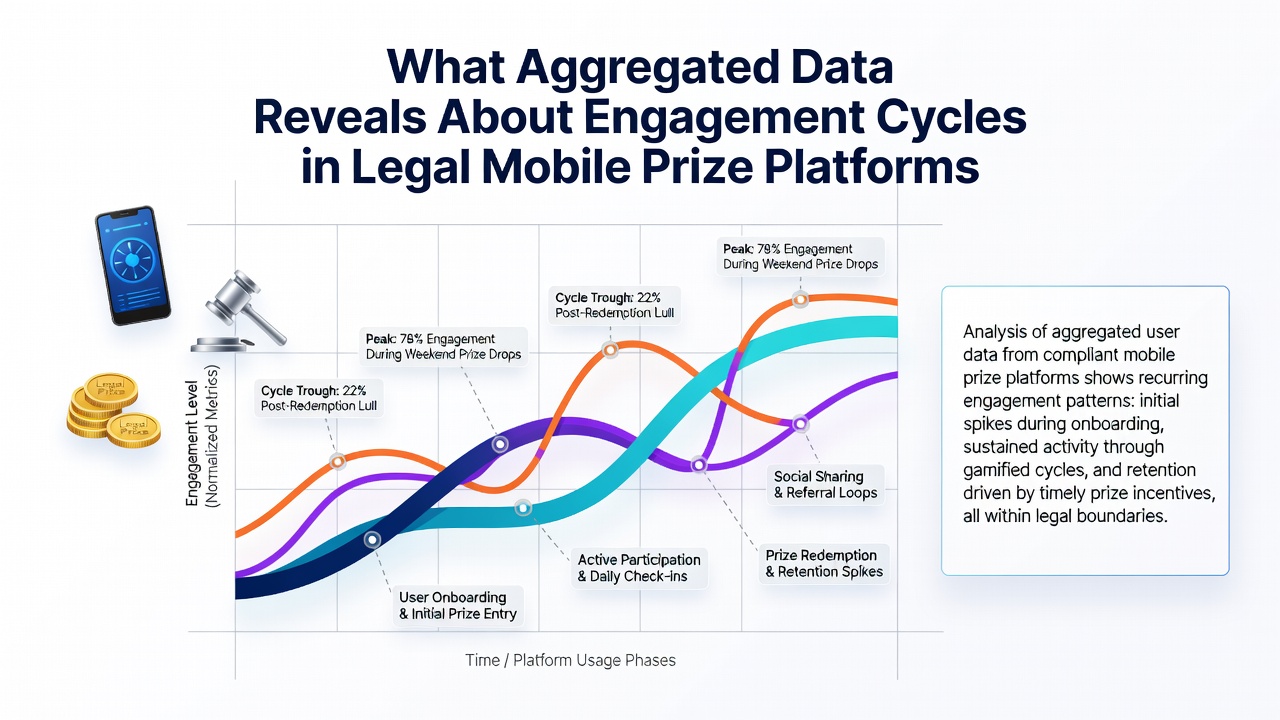
Data from multiple legal mobile prize platforms shows distinct engagement cycles that repeat across daily, weekly, and longer periods, and these patterns emerge clearly when researchers aggregate user activity logs from regulated sweepstakes and contest apps operating in the United States.
Analysts at several firms collect anonymized metrics such as login frequency, coin redemption rates, and session duration, then compare those figures across thousands of accounts to identify peaks that occur at predictable intervals. In July 2026, for instance, aggregated records indicated a measurable uptick in evening participation that coincided with extended daylight hours and summer travel schedules in many states.
Daily and Weekly Patterns in User Activity
Morning hours typically register lower entry volumes while afternoon and early evening windows produce the highest concentration of new contest submissions, and this rhythm holds steady across most platforms even when individual user demographics vary. Researchers have observed that Tuesday through Thursday often yield steadier participation than weekends, because weekday routines allow users to check apps during commutes or lunch breaks without competing against other leisure options.
One study of multi-state operators found that average session length increased by roughly twelve percent on midweek evenings compared with Saturday afternoons, and that trend appeared consistently in datasets spanning more than eighteen months. Those same records also revealed brief spikes right after promotional coin drops, which usually land between 2 p.m. and 4 p.m. local time depending on the jurisdiction.
Seasonal Influences and Longer-Term Cycles
Seasonal shifts become visible once data sets cover multiple quarters, and summer months tend to show broader but shallower engagement curves while fall periods produce sharper peaks tied to back-to-school schedules and holiday planning. Aggregated figures from 2025 into 2026 indicate that July activity levels remained elevated for longer stretches of each day, whereas September brought more concentrated bursts around specific promotional events.
Platforms that release limited-time contest formats during these windows record measurable differences in redemption velocity, and operators adjust server capacity accordingly. External factors such as state-level verification updates can temporarily flatten or extend these cycles, yet the underlying weekly rhythm tends to reassert itself within two to three weeks after any regulatory change.
Factors That Shape Participation Rhythms
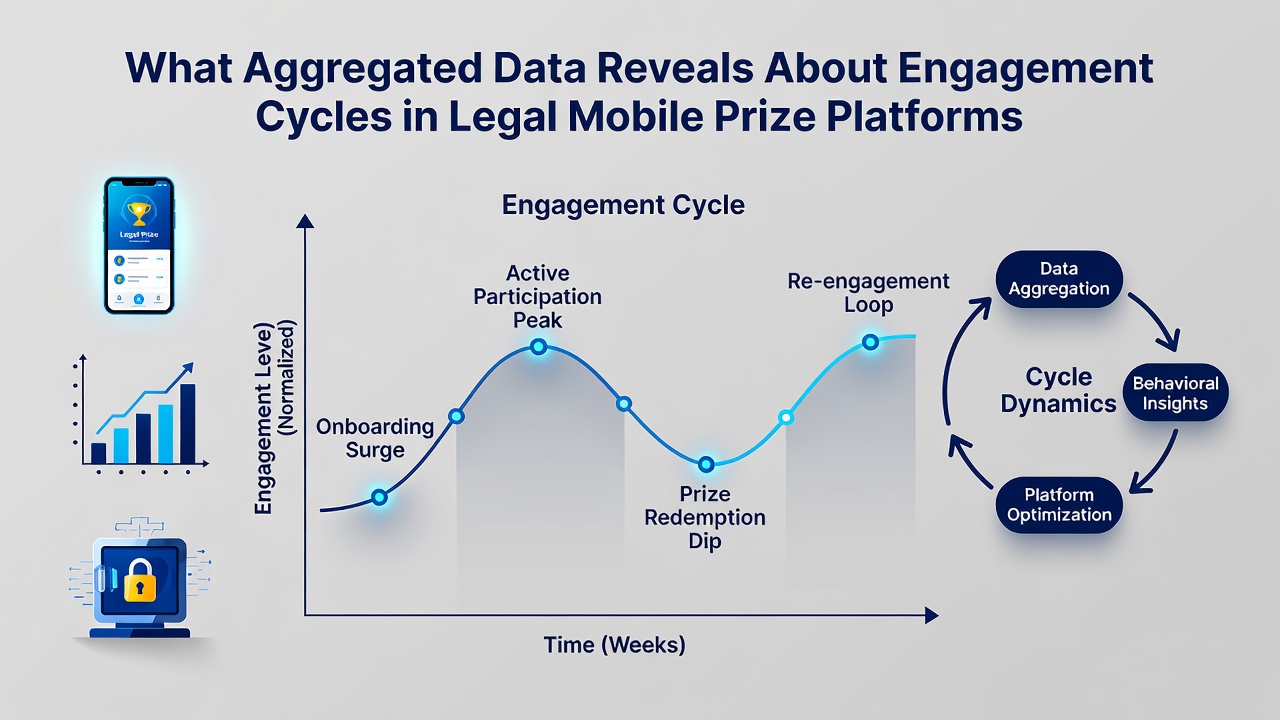
Network performance and device type influence how long users remain active during each session, while interstate differences in verification protocols create noticeable offsets in peak times across state lines. Data collected from cross-platform events shows that users in jurisdictions with faster identity checks log in earlier in the evening than those who must wait for additional state-level confirmations.
Referral programs add another layer, because new accounts acquired through such channels often follow the engagement patterns of the referring user for the first several weeks before establishing independent habits. Observers note that these inherited rhythms gradually diverge as the new account interacts with different promotion schedules and prize structures.
According to figures released by the American Gaming Association, mobile contest participation across regulated platforms grew steadily through the first half of 2026, with the largest share of new accounts originating from states that expanded verification options earlier in the year. A separate report prepared by iGaming Ontario highlights similar weekday preferences among Canadian users of comparable prize applications, suggesting the patterns extend beyond single regulatory environments.
Conclusion
Aggregated data therefore provides operators with reliable forecasts for server load, promotion timing, and resource allocation, and these forecasts improve as more platforms contribute standardized metrics to shared research pools. The resulting picture shows engagement cycles that remain stable enough for planning purposes while still responding to seasonal, regulatory, and technological variables that shift over time.